Waste Management

Litter 1

Policy

To track waste flow, ensure that all waste is treated properly, and promote waste recycling

Litter 2

Goal

Short-term: Continues to promote waste reuse and good waste treatment in entire plants.
Mid and Long-Term: The entire plant's waste recycling rate up to 100%.

Litter 3

Management

  1. Carry out the waste supplier evaluation mechanism and contract management, and confirm each removal and proper disposal flow.
  2. Increase the diversity of chemical removal channels to achieve material recycling benefits.
  3. Promote and implement recycling to employees and waste management control.
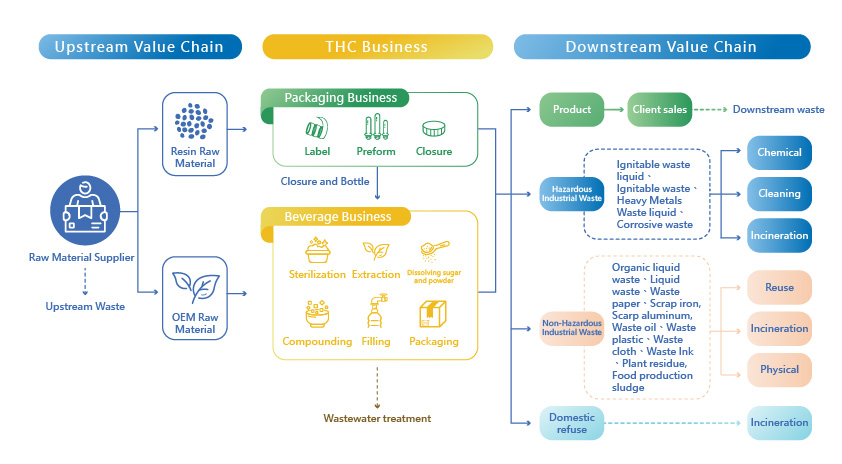
Conditions for waste
  • In 2024, the total waste volume was 17,012 tons, an increase of 10.9% compared to 2023 (up by 1,667.4 tons). This included 16,959.7 tons of general industrial waste and 52.3 tons of hazardous industrial waste. The total waste removal volume was 17,050.87 tons, an increase of 1,691.62 tons from the previous year. Due to the phase-out of gravure printing, hazardous waste decreased by 90.7 tons, contributing to a total reduction of 46.86 tons. The company-wide waste reuse rate remained at 98%.
  • Packaging Division: Plastic waste (e.g., PET preforms, caps, waste labels) is sorted and mostly reused. Hazardous waste is primarily printing ink solvents (C-0301) and their mixtures (C-0399), generally disposed of through incineration.
  • Beverage Division: Main waste includes plant residues (R-0120) and food processing sludge (R-0902). Plant residues are converted into organic fertilizer, while sludge is used for biogas power generation or as boiler fuel.

Waste Treatment (Tons)


Packaging Division-
Waste Emission Intensity and Recovery Rate


Beverage Division-
Waste Index 


Waste Disposal Volume (Tons)


2024 Packaging Division
Waste Treatment by Type of Recovery (Tons)


2024 Beverage Division
Waste Treatment by Type of Recovery (Tons)

 
Packaging Division (The reuse rate of waste is 95%)
  • After waste generation, segregation and collection are carried out using space bags or compatible containers. The majority of plastic waste undergoes recycling for backend processing. Waste that cannot be recycled or poses potential environmental pollution risks is generally treated through incineration.
  • Continue to promote converting plastic waste into RDF.
Beverage Division (The reuse rate of waste is 98%)
  • Vegetable residues: After waste generation, vegetable residues are collected using containers and then mixed with animal manure to produce pelletized fertilizers for agricultural use.
  • Sludge waste: Reusing sludge waste as renewable energy through anaerobic biogas power generation or used as boiler fuel for steam generation. Some sludge was thermally treated to produce alternative fuels for cement production, turning waste into energy. These practices not only diversify disposal methods but also promote material recycling and circular economy benefits.
  • Supplier Assessment
  • Communicate environmental policy
  • Entrust a legal removal vendor to take care of the waste.
  • During the removal period, the GPS track is confirmed and the vehicle is followed from time to time to make sure the waste is indeed delivered to the treatment facility.
  • After final disposal, proactively track the disposal situation and keep records of proper waste disposal for reference, to ensure the waste can be properly handled.